



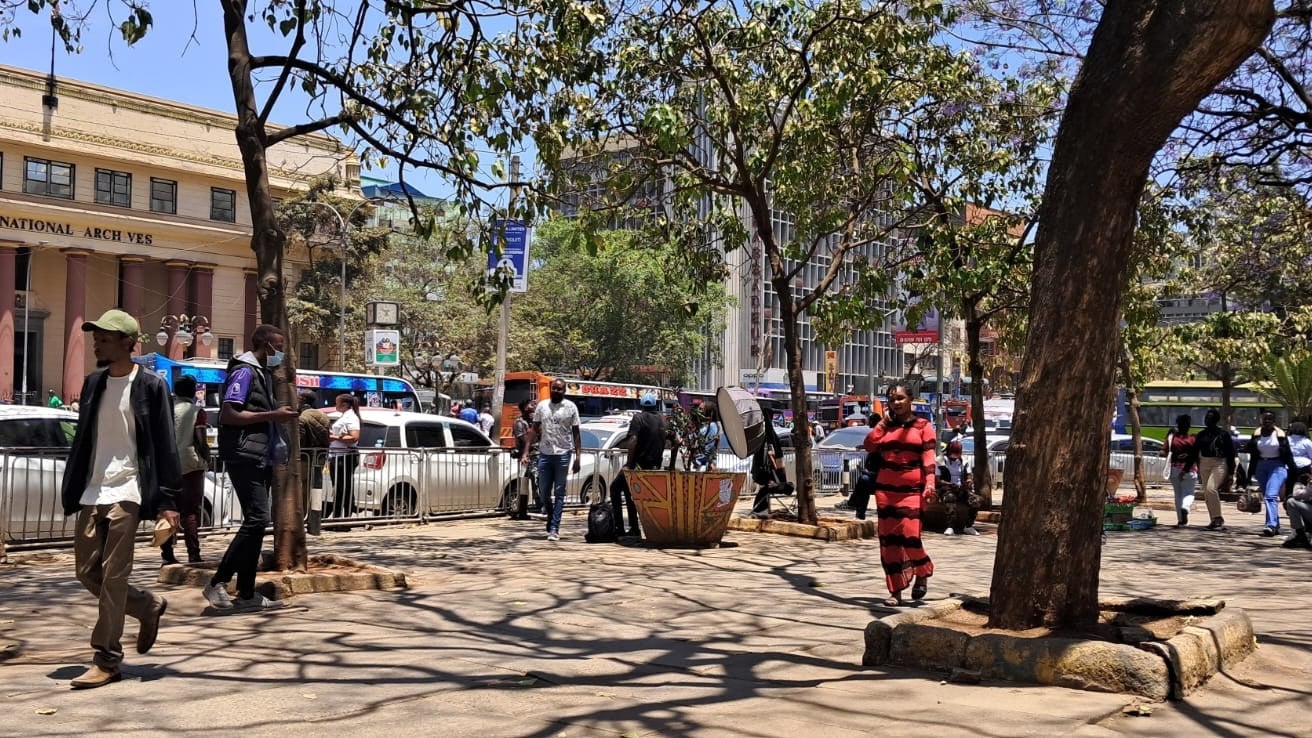
Kenya’s annual inflation rate rose to 6.8 percent in September from 6.6 percent in August. Core inflation drove the increase, climbing to 4.0 percent from 3.4 percent, according to the Kenya National Bureau of Statistics (KNBS) and NCBA Economics and Research.
“Annual consumer price inflation was 6.8 per cent in September 2026,” KNBS said. The consumer price index rose to 156.47 from 155.85 in August, a monthly gain of 0.4 percent.
What 6.8 percent means for a household
An item that cost KSh 100 in September 2025 costs KSh 106.80 now. The government’s target range for inflation is 2.5 percent to 7.5 percent, so the rate sits 0.7 points below the ceiling.
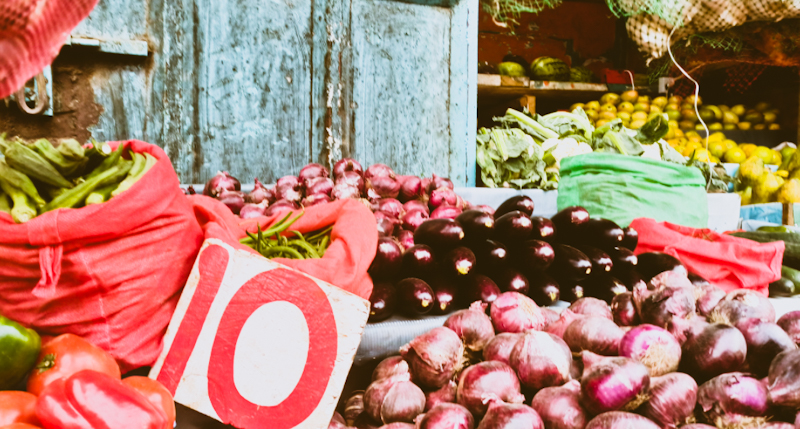
Food matters most to household budgets. It makes up 32.9 percent of the basket KNBS uses, more than any other group. A packet of fresh milk (500 ml) cost KSh 3.49 more in September than in August. A household that buys one packet a day pays about KSh 105 more a month for milk alone.
Core prices lift the headline rate
Core inflation tracks items with steadier prices, such as processed food, health services, education and communication. Non core inflation covers items with volatile prices, such as fresh produce and fuel. The core index moved to 134.66 from 134.01.
| Measure | August 2026 | September 2026 | Contribution to headline (points) |
|---|---|---|---|
| Headline inflation | 6.6% | 6.8% | 6.8 |
| Core inflation | 3.4% | 4.0% | 4.2 |
| Non core inflation | 14.7% | 14.0% | 2.6 |
| Food inflation | 9.0% | 9.5% | 2.8 |
Source: KNBS, NCBA Economics and Research. Food is a division within the headline basket, so its contribution overlaps with the core and non core figures.
Why prices rose
The dry spell cut food supply. NCBA said the dry spell created shortages of beef and milk and pushed up vegetable prices. When less milk reaches the market, sellers charge more for it. The effect carries into processed products. Long life milk rose 8.0 percent in a month, fresh packeted milk rose 6.0 percent and fresh unpacketed milk rose 5.8 percent.
Wheat flour followed global supply pressure. White wheat flour rose 4.5 percent in a month. NCBA lists the Black Sea disruption and the Russia and Ukraine war among pressures on agricultural commodities. The reports do not name a single cause for the flour increase.
Oil prices keep fuel costs high. NCBA said Brent crude trades above $100 a barrel, with the US and Iran conflict and the Russia and Ukraine war weighing on energy markets. Petrol sells at KSh 214.95 a litre, up 15.8 percent in a year. Diesel sells at KSh 219.04, up 26.9 percent.
NCBA also said supply of refined products such as diesel is constrained amid a wide cracking spread, which is the gap between the price of crude oil and the price of the fuels refined from it. Fuel prices did not change from August.
Energy costs pass into other prices. NCBA called this a second round effect. Producers and transporters use fuel, so higher fuel costs raise the price of the goods they make and move. NCBA said producers are expected to keep passing these costs to consumers. This helps explain why core inflation is rising even though core items do not swing as widely as fresh produce.
The fuel tax cut limits the damage. NCBA lists lower VAT on fuel as a domestic factor. The fuel subsidy and the VAT reduction expire in mid October.
The trend: three phases in 13 months
| Month | Headline | Core | Non core | Food |
|---|---|---|---|---|
| Sep 2025 | 4.6% | 2.9% | 9.6% | 8.4% |
| Oct 2025 | 4.6% | 2.7% | 9.9% | 8.0% |
| Nov 2025 | 4.5% | 2.3% | 10.1% | 7.7% |
| Dec 2025 | 4.5% | 2.0% | 11.2% | 7.8% |
| Jan 2026 | 4.4% | 2.2% | 10.3% | 7.3% |
| Feb 2026 | 4.3% | 2.1% | 10.1% | 7.3% |
| Mar 2026 | 4.4% | 2.1% | 10.8% | 7.7% |
| Apr 2026 | 5.6% | 2.8% | 13.4% | 8.8% |
| May 2026 | 6.7% | 3.2% | 16.0% | 9.4% |
| Jun 2026 | 6.4% | 3.1% | 15.1% | 8.6% |
| Jul 2026 | 6.5% | 3.2% | 15.0% | 9.0% |
| Aug 2026 | 6.6% | 3.4% | 14.7% | 9.0% |
| Sep 2026 | 6.8% | 4.0% | 14.0% | 9.5% |
Source: KNBS, NCBA Economics and Research.
Phase one, September 2025 to March 2026: flat. Headline inflation stayed between 4.3 percent and 4.6 percent. Food inflation fell to 7.3 percent in January and February.
Phase two, April and May 2026: a jump. Headline inflation rose from 4.4 percent in March to 6.7 percent in May. Non core inflation rose from 10.8 percent to 16.0 percent over the same two months. The reports do not give a month by month cause, but NCBA ties the current pressure to the energy shock.
Phase three, June to September 2026: the mix shifts. Headline inflation has risen in each of the last three months, from 6.4 percent in June. Non core inflation has fallen from its 16.0 percent peak to 14.0 percent. Core inflation moved the other way and has doubled from its 2.0 percent low in December. Core jumped 0.6 points in September, the largest monthly move in the period outside May.
The pattern shows pressure moving from volatile items to steadier ones. Falling non core inflation no longer offsets the rise in core inflation, so the headline rate keeps edging up.
Milk and wheat flour post the largest monthly gains
| Commodity | Unit | August 2026 (KSh) | September 2026 (KSh) | Monthly change |
|---|---|---|---|---|
| UHT (long life) milk | 500 ml | 57.08 | 61.64 | +8.0% |
| Fresh packeted milk | 500 ml | 57.74 | 61.23 | +6.0% |
| Fresh unpacketed milk | 1 litre | 73.30 | 77.54 | +5.8% |
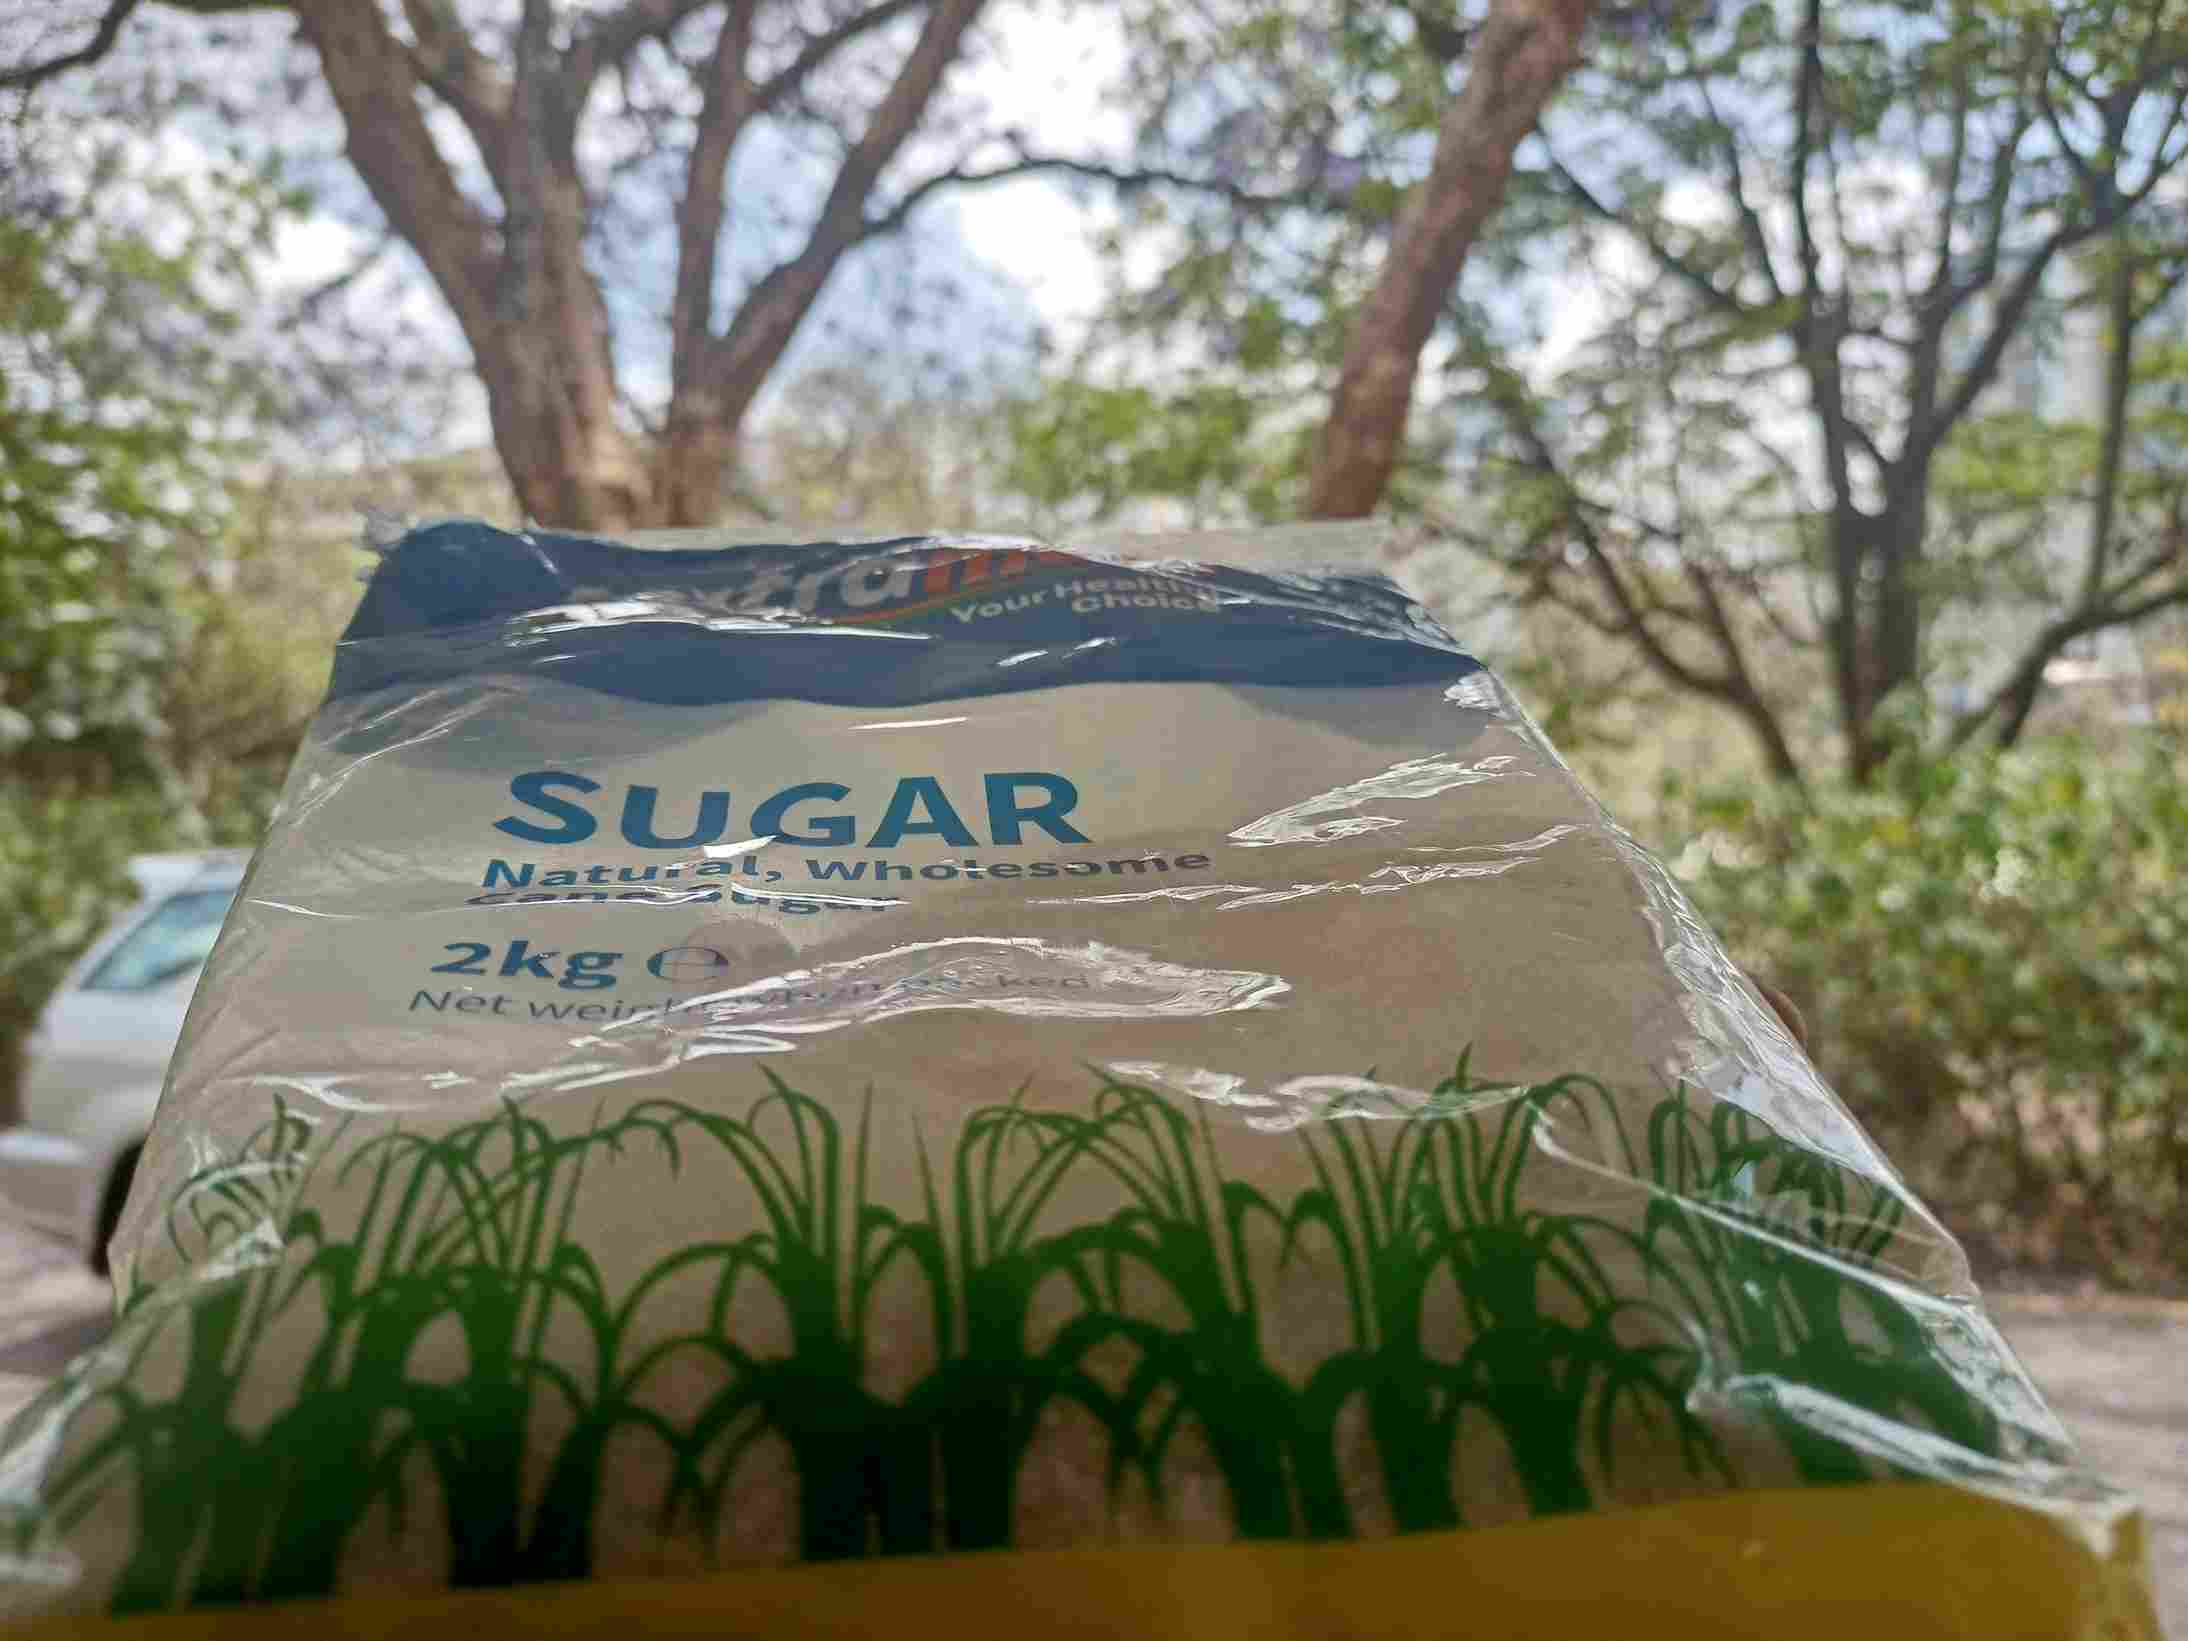
| White wheat flour | 2 kg | 173.35 | 181.11 | +4.5% |
| Sugar | 1 kg | 166.45 | 165.79 | -0.4% |
| Sifted maize flour | 2 kg | 152.89 | 152.00 | -0.6% |
| Tomatoes | 1 kg | 111.03 | 106.44 | -4.1% |
Source: KNBS.

Food and transport carry the annual rate
Three divisions account for more than 57 percent of the index and drove the annual increase.
| Division | Weight | Monthly change | Annual change | Contribution (points) |
|---|---|---|---|---|
| Food and non alcoholic beverages | 32.9% | +0.9% | 9.5% | 2.8 |
| Transport | 9.6% | -0.4% | 15.6% | 1.6 |
| Housing, water, electricity, gas and other fuels | 14.6% | +0.1% | 3.2% | 0.5 |
Source: KNBS.
Vegetable prices rose fastest over twelve months. Vegetables also climbed a year earlier, when potatoes, cabbages and oranges posted double digit gains in September 2024.
| Commodity | September 2025 (KSh per kg) | September 2026 (KSh per kg) | Annual change |
|---|---|---|---|
| Irish potatoes | 91.27 | 121.98 | +33.6% |
| Kale (sukuma wiki) | 92.48 | 122.49 | +32.5% |
| Cabbages | 62.91 | 79.16 | +25.8% |
| Spinach | 103.43 | 127.32 | +23.1% |
| Tomatoes | 87.87 | 106.44 | +21.1% |
| Oranges | 110.84 | 127.22 | +14.8% |
Source: KNBS.

Transport inflation was the highest among the 13 divisions at 15.6 percent. The division index fell 0.4 percent from August because fares eased. City bus and matatu fares fell 0.3 percent and intercity fares fell 1.0 percent. International flight prices rose 8.1 percent.
| Fuel (per litre) | September 2025 (KSh) | August 2026 (KSh) | September 2026 (KSh) | Annual change |
|---|---|---|---|---|
| Petrol | 185.59 | 214.95 | 214.95 | +15.8% |
| Diesel | 172.64 | 219.04 | 219.04 | +26.9% |
Source: KNBS.
Housing, water, electricity, gas and other fuels inflation was 3.2 percent. The price of 200 kWh of electricity fell 2.2 percent in the month to KSh 5,533.76. KNBS did not give a reason for the decline.
Non core inflation eases
Non core inflation eased to 14.0 percent from 14.7 percent in August. Overall inflation was 4.6 percent in September 2025, so the rate has risen 2.2 points in twelve months.
What to watch next
NCBA expects El Niño rains in the fourth quarter to raise the risk of flooding, which could lift food and transport costs. Heavier rain could also raise food supply, and the bank said the rise in core inflation may prove temporary if it does.
The fuel subsidy and the VAT cut on fuel expire in mid October. “We expect headline inflation to average 7.0% in the near term,” NCBA said, assuming both measures stay in place. The reports do not estimate the effect on prices if they lapse.
