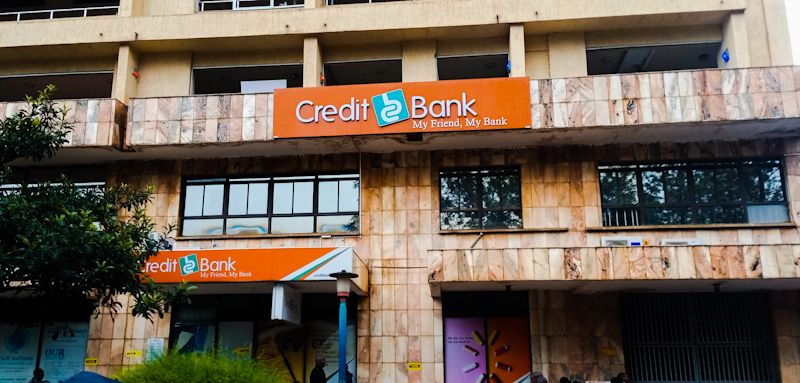
Shorecap III, LP, a private equity fund registered under the laws of Mauritius, with Equator Capital Partners LLC as the manager of the fund, has completed the acquisition of 20 per cent of Credit Bank Kenya.
The Central Bank of Kenya (CBK) announced the deal in early June, and it carried effect on June 15, 2023.
This followed a CBK’s approval on April 24, 2023, under Section 13(4) of the Banking Act and approval by the Cabinet Secretary for the National Treasury and Planning.
The Competition Authority of Kenya in a no objection had qualified the deal “as a merger within the meaning of section 2 and 41 of the Competition Act No 12 of 2010.”
CBK licensed Credit Bank as a non-banking financial institution in 1986. The bank later converted to a fully-fledged commercial bank in 1995. As of the time of the merger, the bank had seventeen branches.
The bank specializes in the provision of banking services to small corporates and Micro, Small and Medium-sized Enterprises (MSMEs). It is categorized as a small bank with a market share of 0.5 per cent.
“This partnership is a win-win…,” said Betty Korir adding that “Just like us Shorecap III LP targets the underserved market.”
“We have observed the market. We have learnt a lot. And by combining our knowledge and ShoreCap III resources, we shall not only flex, but take up a dominant space in this market.” – Mrs. Betty Korir, CEO – Credit Bank. #DaringTheBigLeague pic.twitter.com/a5mDR2WLBi
— Credit Bank PLC (@CreditBankPLC) June 29, 2023
Credit Bank has a market capitalization of KSh25 billion, holds KSh18 billion in deposits and has rented out KSh22 billion.
Credit Bank’s Performance and Key Financial Ratios;
| Cytonn report: Summary of Credit Bank Plc Financials | |||||
| FY’2018 | FY’2019 | FY’2020 | FY’2021 | FY’2022 | |
| Balance Sheet Summary (Kshs bn) | |||||
| Net Loans | 13.0 | 15.2 | 15.6 | 15.5 | 17.5 |
| Total Assets | 17.9 | 21.7 | 23.2 | 26 | 25.8 |
| Customer Deposits | 13.1 | 16.8 | 17.6 | 20.4 | 17.5 |
| Total Liabilities | 15.0 | 18.6 | 20.0 | 22.6 | 22.5 |
| Shareholder’s Funds | 2.9 | 3.0 | 3.2 | 3.4 | 3.3 |
| Income Statement Summary (Kshs mn) | |||||
| Total Operating income | 1,719.4 | 1,794.9 | 1,754.1 | 1,638.3 | 1,575.3 |
| Total Operating expenses | 1,376.5 | 1,492.0 | 1,736.0 | 1,423.9 | 1,629.3 |
| Profit After Tax (PAT) | 248.5 | 393.8 | 92.1 | 138.1 | (1.7) |
| Balance Sheet Ratios | |||||
| Loan to Deposit | 99.3% | 90.6% | 88.6% | 75.9% | 99.5% |
| ROaE | 8.6% | 13.4% | 2.9% | 4.2% | (0.1%) |
| ROaA | 1.4% | 2.0% | 0.4% | 0.6% | (0.01%) |
| Income Statement Ratios: | |||||
| Yield on Interest Earning Assets | 1.8% | 2.3% | 0.5% | 0.6% | (0.01%) |
| Net Interest Margin | 6.6% | 5.4% | 5.6% | 4.3% | 3.6% |
| Cost to Income Ratio | 73.0% | 75.5% | 82.6% | 84.0% | 92.9% |
| Capital Adequacy Ratios: | |||||
| Core Capital liabilities ratio | 20.0% | 16.9% | 16.3% | 8.2% | 9.4% |
| Minimum Statutory requirement | 8.0% | 8.0% | 8.0% | 8.0% | 8.0% |
| Excess/Deficit | 12.0% | 8.9% | 8.3% | 0.2% | 1.4% |
| Core Capital risk-weighted assets ratio | 14.0% | 14.1% | 13.0% | 7.9% | 7.4% |
| Minimum Statutory requirement | 10.5% | 10.5% | 10.5% | 10.5% | 10.5% |
| Excess/Deficit | 3.5% | 3.6% | 2.5% | (2.6%) | (3.1%) |
| Total Capital risk-weighted ratio | 14.5% | 15.0% | 14.5% | 15.8% | 14.9% |
| Minimum Statutory requirement | 14.5% | 14.5% | 14.5% | 14.5% | 14.5% |
| Excess/Deficit | 0.0% | 0.5% | 0.0% | 1.3% | 0.4% |
| Liquidity ratios: | |||||
| Liquidity ratio | 21.0% | 26.0% | 26.5% | 39.4% | 20.5% |
| Minimum Statutory requirement | 20.0% | 20.0% | 20.0% | 20.0% | 20.0% |
| Excess/Deficit | 1.0% | 6.0% | 6.5% | 19.4% | 0.5% |
| Asset quality ratios: | |||||
| Gross Non-Performing Loan Ratio | 8.3% | 10.1% | 11.9% | 27.2% | 27.4% |
| NPL Coverage Ratio | 36.8% | 35.8% | 65.4% | 59.7% | 63.1% |
With this investment, the bank seeks to penetrate the market further and enter into tier-two bank categorization.


