



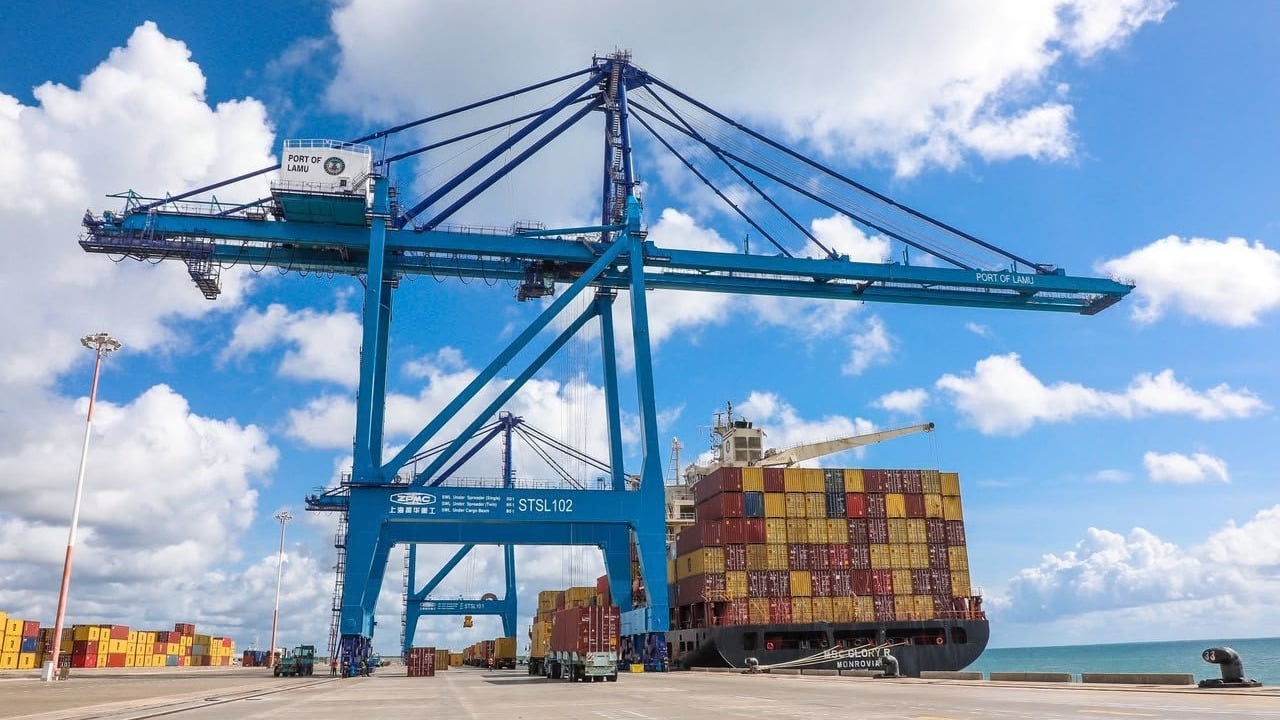
Mombasa Port exported a record 517,131 tonnes in July 2026, up 21.3 percent from 426,164 tonnes a year earlier. Total cargo throughput reached 4.23 million tonnes, up 13.4 percent year on year, according to provisional Kenya Ports Authority (KPA) data published in the Kenya National Bureau of Statistics (KNBS) Leading Economic Indicators for July 2026.
Imports and exports drove the gain while transhipment fell sharply.
July at a glance
| Cargo category | July 2026 (tonnes) | June 2026 (tonnes) | Change on June | Change on July 2025 |
|---|---|---|---|---|
| Exports | 517,131 | 448,817 | +15.2% | +21.3% |
| Containerised exports | 511,545 | 443,807 | +15.3% | n/a |
| Imports | 3,532,050 | 3,119,074 | +13.2% | +18.9% |
| Containerised imports | 1,315,039 | 1,092,488 | +20.4% | +15.3% |
| Dry bulk imports | 1,027,129 | 819,467 | +25.3% | +87.9% |
| Petroleum imports | 778,717 | 792,700 | −1.8% | +15.8% |
| Transhipment | 159,101 | 108,827 | +46.2% | −60.5% |
| Total throughput | 4,229,120 | 3,687,716 | +14.7% | +13.4% |
Source: KNBS Table 19(g), data from KPA. Year on year changes are from the July 2025 comparison supplied with the release.
Exports pass the July 2024 high
Containerised cargo made up 511,545 tonnes of July’s outbound volume, or 98.9 percent of the total. The figure tops the previous monthly high of 504,156 tonnes, set in July 2024, in the KNBS series. It is also the highest of the 12 months in the latest table, ahead of December 2025’s 468,588 tonnes.
Exports have climbed through the year, from 320,203 tonnes in January. July sits 22 percent above the 2026 monthly average of about 423,000 tonnes.
| Month | Exports (tonnes) | Imports (tonnes) | Transhipment (tonnes) | Total throughput (tonnes) |
|---|---|---|---|---|
| Aug 2025 | 421,695 | 3,156,838 | 371,376 | 3,966,292 |
| Sep 2025 | 408,690 | 2,906,792 | 414,097 | 3,757,958 |
| Oct 2025 | 385,627 | 3,318,058 | 306,173 | 4,025,872 |
| Nov 2025 | 443,846 | 3,322,696 | 335,354 | 4,118,571 |
| Dec 2025 | 468,588 | 3,706,277 | 293,763 | 4,480,164 |
| Jan 2026 | 320,203 | 2,976,804 | 194,987 | 3,512,803 |
| Feb 2026 | 397,540 | 3,008,209 | 106,844 | 3,523,996 |
| Mar 2026 | 461,200 | 3,319,281 | 159,450 | 3,960,313 |
| Apr 2026 | 425,490 | 3,142,908 | 127,238 | 3,708,051 |
| May 2026 | 390,589 | 3,271,910 | 195,923 | 3,868,555 |
| Jun 2026 | 448,817 | 3,119,074 | 108,827 | 3,687,716 |
| Jul 2026 | 517,131 | 3,532,050 | 159,101 | 4,229,120 |
Source: KNBS Table 19(g), data from KPA. 2026 figures are provisional.
December 2025 remains the peak at 4.48 million tonnes.

Tea and coffee shipments rise on last year
Tea and coffee are among the produce shipped from Mombasa. Tea has long led export earnings, at KSh 188.7 billion in 2023, according to the 2024 Economic Survey, as Khusoko reported. July’s KNBS figures show both crops shipping more than a year earlier.
| Export | July 2026 | July 2025 | June 2026 | Change on July 2025 |
|---|---|---|---|---|
| Tea volume (tonnes) | 65,830 | 58,645 | 49,668 | +12.3% |
| Tea value (KSh million) | 19,579 | 15,629 | 14,518 | +25.3% |
| Coffee volume (tonnes) | 3,804 | 2,544 | 8,091 | +49.5% |
| Coffee value (KSh million) | 3,450 | 2,533 | 7,651 | +36.2% |
Source: KNBS data from the Kenya Revenue Authority.
Tea shipments rose 32.5 percent on June, after June’s auction volume of 46,527 tonnes. Coffee exports fell 53 percent on June, when the Nairobi Coffee Exchange was in recess, but they remain ahead year to date. Coffee volumes reached 41,698 tonnes from January to July, up 5.6 percent. Tea volumes were flat at about 373,000 tonnes, while tea earnings rose 5.1 percent to KSh 111.1 billion.
Exporters are also seeking capital. Karakuta Fresh Produce, an avocado and herb exporter, plans to list on the Nairobi Securities Exchange.
Dry bulk imports nearly double
Imports rose 18.9 percent to 3.53 million tonnes. Dry bulk cargo led the increase, jumping 87.9 percent to a record 1.03 million tonnes from 546,773 tonnes a year earlier. It is the highest figure in the latest 12 month table, ahead of March’s 1.01 million tonnes. KNBS does not break dry bulk down by commodity.
Containerised imports grew to 1.32 million tonnes and petroleum imports to 778,717 tonnes. Petroleum was 1.8 percent lower than in June, and 19 percent below May’s 958,963 tonnes.
Transhipment slump limits growth
Transhipment volumes fell 60.5 percent to 159,101 tonnes from 403,181 tonnes in July 2025. The drop held back overall throughput growth. It also means trade cargo for Kenya and its neighbours, not goods moving between vessels, produced July’s gains.
The fall has lasted. Transhipment averaged about 344,000 tonnes a month from August to December 2025 and about 150,000 tonnes from January to July 2026, a 56 percent drop. Month on month, July rose 46 percent from June’s 108,827 tonnes. Authorities have also sought to steer more transhipment cargo through Lamu Port to ease pressure on Mombasa.
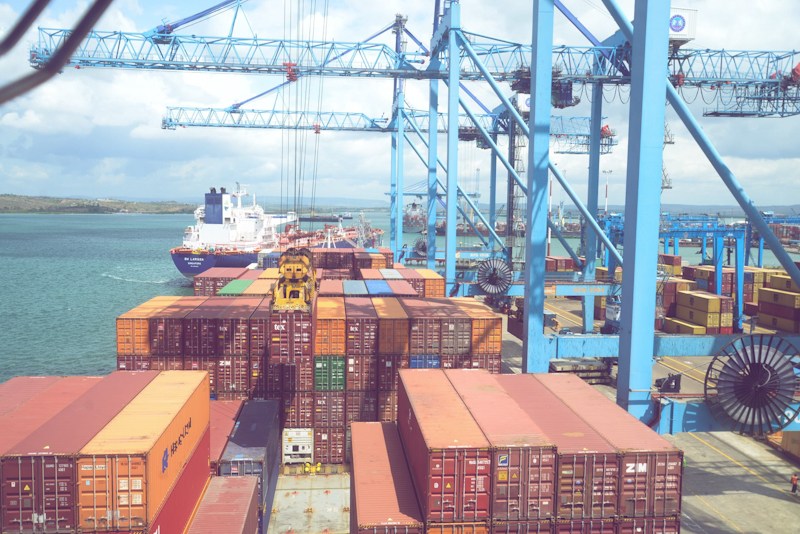
Trade values follow the tonnage
The value of trade shows the same pattern. Total exports reached KSh 128.8 billion in July, up 32.6 percent on a year earlier. Imports rose 18.3 percent to KSh 298.7 billion, close to the 18.9 percent rise in import tonnage at the port.
| Trade value (KSh million) | July 2026 | June 2026 | July 2025 |
|---|---|---|---|
| Domestic exports | 107,051 | 103,323 | 81,827 |
| Reexports | 21,720 | 14,704 | 15,299 |
| Total exports | 128,771 | 118,027 | 97,126 |
| Total imports | 298,679 | 300,165 | 252,503 |
| Trade deficit | 169,908 | 182,138 | 155,377 |
Source: KNBS Table 12, data from the Kenya Revenue Authority. Figures exclude electricity and informal cross border trade.
Food and beverages made up 41.5 percent of domestic exports. Industrial supplies took 26.8 percent, up from 22.5 percent in June.
Uganda (KSh 12.6 billion), the United States (KSh 12.4 billion) and the United Arab Emirates (KSh 8.8 billion) led destinations. Exports to the UAE more than doubled from June.
On the import side, China (KSh 90.1 billion), India (KSh 56.1 billion) and Saudi Arabia (KSh 19.4 billion) led origins. Industrial supplies were 37.4 percent of imports and fuel 22.9 percent.
The deficit fell 6.7 percent on June to KSh 169.9 billion, but sits 9.4 percent above July 2025.
Fuel costs weigh on moving cargo inland
Cargo that clears Mombasa still has to reach Uganda, Rwanda and inland depots, and diesel sets much of that cost. The national average diesel price stood at KSh 222.86 a litre in July, up 32.9 percent from KSh 167.72 in March. Petrol averaged KSh 214.03. The OPEC basket crude price has eased to USD 82.99 a barrel from USD 116.36 in March, but pump prices have not followed. Annual inflation was 6.49 percent in July, against 4.39 percent in March.
Rail is taking more of the load. The Standard Gauge Railway carried 4.10 million tonnes of freight from January to June 2026, up 15.1 percent from 3.56 million tonnes a year earlier. June’s 719,589 tonnes was 23.7 percent above June 2025. Freight revenue rose 4.0 percent to KSh 9.19 billion. July rail data is not yet available.
A record year sets the base
| Indicator, 2025 | Volume | Change on 2024 |
|---|---|---|
| Total cargo handled | 45.45 million tonnes | +10.9% |
| Container traffic | 2.11 million TEUs | +5.5% |
| Transit cargo (Northern Corridor) | 15.88 million tonnes | +19.5% |
Source: KPA. The 2024 total was 40.99 million tonnes.
Congestion eases as volumes rise
Higher volumes have tested the port’s yards and cargo evacuation systems. Severe congestion in 2025 pushed average vessel turnaround well above the port’s target. It has since fallen below it.
| Vessel turnaround | Average hours |
|---|---|
| Q1 2025 | about 226 |
| Q1 2026 | about 53 |
| Port target | 72 |
The Northern Corridor Transport Observatory credited steadier berth schedules, tighter yard management and upgrades to the Terminal Operating System.
KPA and the Kenya Revenue Authority added measures in January to speed clearance. They widened pre arrival processing, cleared long stay containers, introduced more cargo tracking seals and moved more cargo by rail to inland container depots.
New vessel traffic system
On July 8, KPA commissioned a KSh 1 billion Vessel Traffic Management and Information System at Mombasa. It runs from a control tower, the Ras Serani Signal Station and the Shimanzi Oil Terminal radar site, and combines radar, vessel tracking and marine communications.
The project also bought two tugboats and a helicopter, and more than 30 staff received training, according to Radio Kaya.
KPA Managing Director William Ruto said “modern technology has become essential” for safe navigation as vessel traffic grows.
July’s numbers show the port moving more cargo without the delays of early 2025. The next KNBS release will show whether exports hold above 500,000 tonnes, and whether rail and road links inland keep pace.
