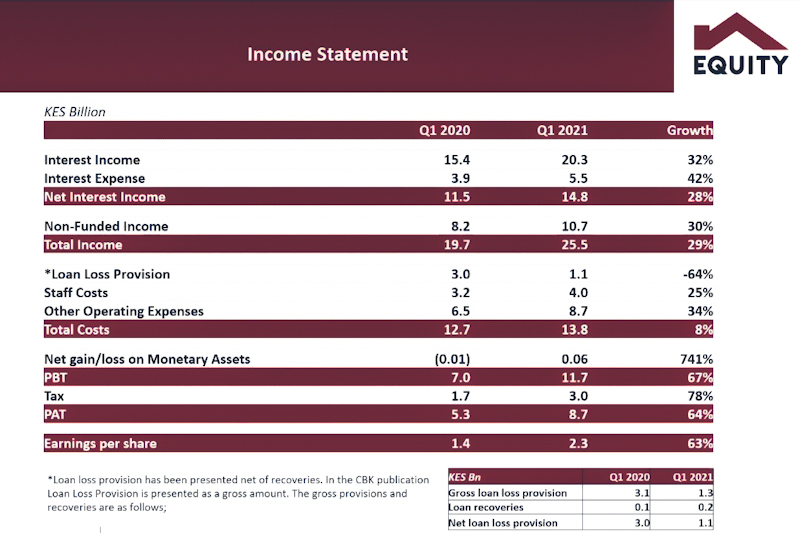
Equity Group Holdings on Wednesday announced its financial results for the quarter ended March 30, 2021. The bank posted a 64 per cent growth in net profit at Ksh 8.7bn in Q21FY21, as compared to KSh5.3 billion in the corresponding period of last year.
The lender’s net interest income grew 28 per cent to KSh14.8 billion in line with 29 per cent growth in loan book to KSh487.7 billion.
“Our strategy; purpose-first, inclusivity, affordability, reach, agility and quality have proven resilient and sustainable,” said Dr James Mwangi, the Equity Group CEO while releasing the first quarter of 2021 financial results. “Purpose has proved profitable” he added.
Regional subsidiaries registered resilience and robust growth to contribute 40 per cent of total deposits and total assets and 23 per cent of profit before tax with Rwanda and Uganda delivering above the cost of capital returns.
The Group registered a balance sheet expansion of 54 per cent to reach Kshs.1.07 trillion driven by a 58 per cent growth in customer deposits underpinned by Kshs.140 billion shareholders’ funds.
“A liquid balance sheet with Kshs.500 billion of cash, cash equivalents and government securities reflect the agility to redeploy funding seamlessly as the economies recover from the adverse impact of the Covid-19 multi-crisis,” said Mwangi.
Other highlights
- Earnings Per Share (EPS) increased to Kshs.2.29 from Kshs.1.41 over the same period in 2020.
- Total Assets increased 53.8% to Kshs.1Tn mainly supported by 531% growth in Deposits and balances due from banking institutions abroad to Kshs.123.8Bn, as well as 36.4% growth in investment securities to Kshs.258.9Bn.
- Loan and advances up 28.6% over the period under review to Kshs.487.7Bn.
- Customer deposits increased 58.2% to Kshs.789.9Bn compared to Kshs.499.3Bn Q1 2020.
- Total Interest Income increased 31.9% to Kshs.20.3Bn on the back of 31.5% rise in interest income from loans and advances to Kshs.14.2Bn and 30% increase in interest income from government securities to Kshs.5.9Bn.
- Total Interest expense increased by 42.4% to Kshs.5.5Bn compared to Kshs.3.9Bn Q1 2020, attributable to a 13.4% rise in other interest expense.
- Non-Funded Income (NFI) up 30.7% to Kshs. 10.9Bn (Q1 2020 – Kshs.8.3Bn) as a result of 18.2% and 82.7% rise in fees and commissions income on loans and advances as well as rise in foreign exchange trading income respectively.
- This growth is a reflection of the continued strong performance of alternative banking channels with only 1.6% of total transactions being done at the branch.
- Total operating expenses grew 8.7% to Kshs. 13.9Bn attributable to 34% and 25% increase in other operating expenses (Kshs. 8.7Bn) and staff costs (Kshs. 4Bn) respectively.
- The Group’s Cost to Income Ratio (CIR) remained fairly stable at 49.8% (2020 – 49.2%).
- Loan loss provisions down 59.3% to Kshs. 1.3Bn ( Kshs. 3.1Bn Q1 2020).
- Asset Quality – Gross Non-Performing Loans (NPL) increased 42.2% to Kshs. 63.5Bn from Kshs. 44.6Bn a reflection of the fast pace in loan book growth during the period and higher loan defaults resulting from the pandemic.
- Gross NPLs for the period stood at 11.3% higher than 11% over the same period in 2020 but lower than the 14.65 industry average.
Additional information from Sterling Capital Research.


