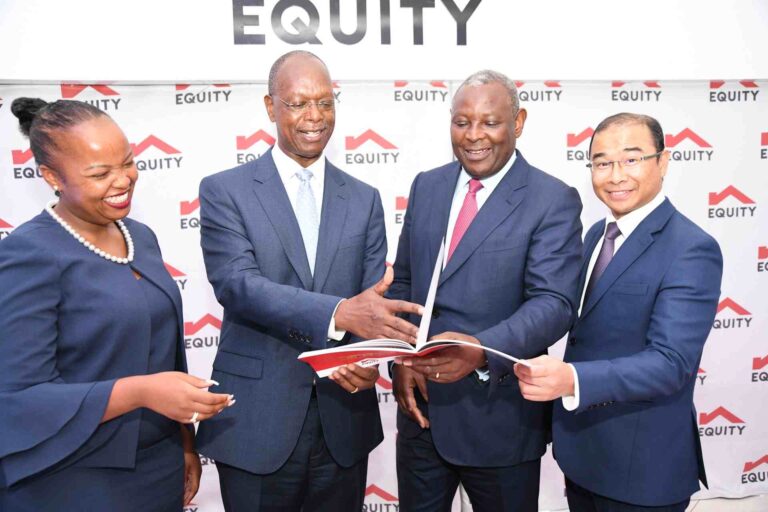
After reporting a jump in its net profit, Equity Group Holdings declared a dividend of Sh4 per share for 2022, a 33 per cent rise from Ksh 3 paid in 2021.
The dividend payout amounts to KSh15.1 billion—an equivalent of 33 per cent of net earnings.
The dividend will be paid on or before June 30 to the members in the company’s share register on the closure of May 19. However, this will be subject to approval at the annual general meeting on June 21.
The Board has recommended a dividend payout of KES 15.1B from KES 11.3B a 33% growth with dividend per share at KES 4 from KES 3 – Dr. Mwangi, Equity Group MD & CEO#Equity2022FYResults pic.twitter.com/iu7b8XwLa5
— Equity Bank Kenya (@KeEquityBank) March 28, 2023
“Equity is not about numbers. It is a human story built to solve problems in the society. But this human story manifests itself in numbers. It is a story of consistency,” said Dr. James Mwangi, Group Managing Director and CEO, as he released the results Tuesday.
“The Group’s 2022 results reflect the resilience that the business has developed due to deliberate and intentional leadership and management decisions through interest capping period and COVID- 19 pandemic environment, strategically positioning the business to navigate the evolving macroeconomic headwinds and turbulence in the financial and economic sectors,” added Dr. James Mwangi.
| Balance Sheet Items | FY’2021 (Kshs bn) | FY’2022 (Kshs bn) | y/y change |
| Government Securities | 228.5 | 219.2 | (4.1%) |
| Net Loans and Advances | 587.8 | 706.6 | 20.2% |
| Total Assets | 1,304.9 | 1,447.0 | 10.9% |
| Customer Deposits | 959.0 | 1,052.2 | 9.7% |
| Deposits per Branch | 2.8 | 3.0 | 4.4% |
| Total Liabilities | 1,128.7 | 1,264.8 | 12.1% |
| Shareholders’ Funds | 169.2 | 176.2 | 4.2% |
| Balance Sheet Ratios | FY’2021 | FY’2022 | % points y/y change |
| Loan to Deposit Ratio | 61.3% | 67.2% | 5.9% |
| Gov’t Securities to Deposit Ratio | 23.8% | 20.8% | (3.0%) |
| Return on average equity | 26.6% | 26.7% | 0.1% |
| Return on average assets | 3.5% | 3.4% | (0.1%) |
| Income Statement | FY’2021 (Kshs bn) | FY’2022 (Kshs bn) | y/y change |
| Net Interest Income | 68.8 | 86.0 | 25.0% |
| Net non-Interest Income | 44.6 | 59.9 | 34.5% |
| Total Operating income | 113.4 | 145.9 | 28.7% |
| Loan Loss Provision | (5.8) | (15.4) | 163.7% |
| Total Operating expenses | (61.5) | (86.1) | 40.0% |
| Profit before tax | 51.9 | 59.8 | 15.3% |
| Profit after tax | 40.1 | 46.1 | 15.1% |
| Core EPS | 10.6 | 12.2 | 15.1% |
Equity Bank Balance Sheet to Hit Ksh 3 Trillion Mark by 2025


